Delivered to your inbox: The AppD latest news, webinars, updates, courses, tips, and more!
SubscribeFirst Quarter 2024
In the past three months, there has been an amazing amount of innovation delivered across the entire Cisco AppDynamics portfolio. The following are just some of the innovations we would like to share with you. Be sure and check out our documentation or reach out to a sales representative or sales engineer to discuss how our innovative solutions are helping large enterprise organizations address real-world problems and challenges.
Cisco Secure Application on Cisco Observability Platform
Cisco is now providing data security and cloud security capabilities on Cisco Secure Application as a standalone Cisco Observability Platform application. Cisco Secure Application can be deployed with or without cloud-native application performance monitoring from Cisco Cloud Observability, to help organizations secure cloud-native applications and safeguard sensitive data at scale. See Cisco Secure Application.
The new Data Security module unlocks deep data visibility by automatically discovering and classifying sensitive data at scale, provides efficient controls and secures data from both internal and external threats with continuous monitoring. It helps save time and effort by avoiding manual tasks and ensures the data is compliant with the latest regulatory standards like GDPR (General Data Protection Regulation), HIPAA (Health Insurance Portability and Accountability Act), and PCI DSS (Payment Card Industry Data Security Standard) among others. GenAI-powered alerting and guidance is provided which helps to expedite remediation of security issues at scale.

Label: Data Security module for Cisco Security Application on Cisco Observability Platform
The new Cloud Security module delivers real-time visibility and actionable insights to quickly locate, prioritize, and remediate security issues in cloud-native environments. Locate security issues across application entities (business transactions, services, workload, pods, containers) with ease, so they can be quickly isolated, while prioritizing issued based on a business risk score that combines application and business impact context, while vulnerability detection and security intelligence from Cisco security products make it easy to identify which business transactions have the greatest risk. This new module accelerates response with real-time remediation guidance, placing a prescriptive set of actions in place that addresses the most impactful vulnerabilities.

Label: Cloud Security module for Cisco Security Application on Cisco Observability Platform
Cisco AIOps for Cisco Cloud Observability
Cisco AIOps is an inter-domain cloud based solution that provides an end-to-end visualization of the applications and infrastructures, incident correlation, event monitoring, and actions. You get a unified view of all operational domains in a single pane, for example, across AppDynamics (cSaaS), ServiceNow, ThousandEyes, Splunk, VMWare, and Cisco DNA Center. The actionable and correlated insights help to reduce the mean-time-to-detect (MTTD) and mean-time-to-resolve (MTTR) issues. Access Cisco AIOps as a Cisco Cloud Observability module, which is built on the Cisco Observability Platform. See Cisco AIOps.

Label: AIOps dashboard example
New Cisco AIOps Integrations
You can integrate Cisco AIOps with the following data sources to ingest various metrics and events for better visibility, correlation, and quicker remediation of issues.
These are the latest in a series of integrations, categorized into supported domains, for AIOps.
- Cisco AIOps for Cisco AppDynamics SaaS (Application & Digital Experience domains) ensures the events tied to the performance of applications, servers, and databases are correlated to help better understand the impact of outages, improves visibility, and expediates remediation of issues. See Cisco AppDynamics SaaS Integration.
- Cisco AIOps for Splunk Enterprise (Log Management domain) brings the Splunk alerts into Cisco AIOps to correlate it with data from other monitoring tools. See Splunk Integration.
- Cisco AIOps for Cisco DNA Center (Network domain) offers centralized, intuitive management that makes it fast and easy to design, provision, and apply policies across your network environment. It provides end-to-end network visibility and uses network insights to optimize network performance and deliver improved user and application experience. See Cisco DNA Center Integration.
- Cisco AIOps for ServiceNow (Application & Operation Management domains) ensures there are insights into IT incidents, problems, and change requests, helping address the Mean-time-to-detect and remediate. See ServiceNow Integration.
- Cisco AIOps for ThousandEyes (Digital Experience & Network domains) supports corelated network incidents reduce the time to investigate and remediate issues, improving application delivery and reduces service interuptions. Any alert received within AIOps will be correlated with ThousandEyes and other sources, such as Sciencelogic, Splunk, and AppDynamics, providing a holistic view that ensures efficient delivery of services. See ThousandEyes Integration.
- Cisco AIOps for VMWare vCenter (Infrastructure domain) provides a single pane of glass that incorporates and correlates the computing infrastructure resource metrics. See VMWare vSphere Integration.
Cisco Digital Experience Monitoring for Cisco Observability Platform
The new Cisco Digital Experience Monitoring (DEM) application for Cisco Observability Platform provides real-time monitoring of areas of where user experience can be impacted. Things such as slow page load times or vulnerabilities that contirbute to disruptions. See Cisco Digital Experience Monitoring.

Label: Main Digital Experience Monitoring dashboard
Browser Real User Monitoring (BRUM) module for DEM
The new Browser Real User Monitoring (BRUM) module helps with insights into your user's experience. It allows you to drill into real data and understand how users interact with your application. Core Web Vitals are a part of this correlated analysis, providing an industry standard baseline, developed by Google, for compairing with other web sites across the world wide web. They are also important for SEO as they represent a user’s experience and could impact engine rankings. A better performing web site is not just good for an end user, but for the search engine rankings which will drive more users to your website. See Browser Real User Monitoring Metrics.

Label: Browser Real User Monitoring with Core Web Vitals on Cisco Digital Experience Monitoring
Browser Real User Monitoring (BRUM) module with Session Replay for DEM
The new BRUM with Session Replay module visually replays user sessions to analyze user behavior and optimize the website or application. This new feature aids in identifying bottlenecks and improves the overall user experience. You will understand, first hand, what it is like to navigate your web site’s various pages through the lens of an end user. See Session Replay.

Label: Session Replay on Cisco Digital Experience Monitoring
Service Level Management module for Cisco Cloud Observability
You can now subscribe to the new Service Level Management (SLM) module to track the reliability of Business Transactions by defining SLOs, visualizing trends and being alerted based on budgets consumed or the burn rates. See Service Level Management.

Label: Service Level Management in Cisco Cloud Observability
Kubernetes® Network Monitoring using eBPF for Cisco Cloud Observability
Live network monitoring of Kubernetes workloads with ePBF technology enables users to securely run programs in a Linux kernel space by monitoring packates without a need for traditional packet capture tools. eBPF is a versatile framework capable of instrumenting and tracing various aspects of system behavior in real-time.
With this new functionality, you can monitor incoming and outgoing TCP/UDP network connections in the context of Kubernetes-aware metadata, instead of ephemeral IP addresses, and visualize network connections, relationships, and dependencies within the first few minutes of deployment without any code changes. See Network Monitoring.
New Partner modules for Cisco Cloud Observability
There have been eight new partner modules delivered thus far, which aims to ensure you gain the most value from your existing investments with extensibilty built right into the platform. We are creating an observability ecosystem with global partners across categories including AIOps, MLOps, networking, infrastructure observability and business insights. See Cisco Observability Platform Exchange.
These are the latest in a series of new partner modules on the Cisco Observability Platform:
- Aporia – Machine Learning Monitoring.
- CloudFabrix – Asset Intelligence, Operational Intelligence and Infrastructure Observability.
- Komodor – Kubernetes Change Management.
- Perform IT – AS400 Monitoring and I4Cube business performance.
- SoftServe – Operational Intelligence for Oilfields.
Agent Management for Cisco Cloud Observability
Agent Management with the Smart Agent was made available for SaaS and On-Premises customers this past November and is now available on Cisco Cloud Observability starting with Kubernetes® agents being managed by the Smart Agent and from within the friendly GUI. See Agent Management.

Label: Agent management for Cisco Cloud Observability
Role-Based Access Controls for SaaS and On-Prem Agent Management
We have brought role-based access controls to both SaaS and On-Prem. RBAC allows non-admin users with account-based access control to install agents and non-admin users with application-based access control to view the agent inventory, which would allow for review of versioning compliance standards, running reports, etc. and edit options for their respective application agents.

Label: Account-based access control to install agents.

Label: Application-based access control to view and/or edit agents.
Custom artifactory for SaaS and On-Prem Agent Management
Having the ability to customize where you install or update agents means when you scale, you are not relying on an internet connection with the Cisco AppDynamics download portal. This support is available for both SaaS and On-Premises customers alike, with, or without SSL.

Label: Custom artifactory support
Cisco Secure Application enhancements for SaaS
Cisco Secure Application reduces the risk of security exposure without compromising the delivery speed for an APM-managed application. It enables continuous vulnerability assessment and protection by scanning code execution to prevent possible exploits. If you want to correlate security insights with application performance monitoring, Cisco Secure Application has you covered.
Panoptica Findings are now available which provides IP addresses and other security information associated with an API domain name, such as open ports, vulnerabilities, the TLS version, missing required headers, and more.
Role-based access controls ensure only those who have rights to view security-related content, on a per-application basis, can. There are concerns with presenting security vulnerabilities, so that access should be restricted. With RBAC for Cisco Secure Application, you can now restric sensitive security related content on a per-application/user basis.

Label: Role-based access controls for Cisco Secure Application
Application log troubleshooting: a Unified Observability Experience for SaaS and Cisco Cloud Observability
Unified Observability Experience leverages the best capabilities of both AppDynamics SaaS and Cisco Cloud Observability by maintaining context in your troubleshooting workflows.
Troubleshooting logs is crucial when there is a need to gain deep insights in order to decipher what has occured, including right before an event. But analyzing logs can be cumbersome in large environments. We are making log analysis as efficient as possible with capabilities such as: view related logs so you are not having to look in multiple location for the same signals with parsing pattern detection and processing with customizable rules, natural language processing (NLP) algorithms, and even data security features such as data masking, each ensuring you address and understand the over arching issue with a minimum amount of analysis.
We have brought the power of Cisco Cloud Observability log analysis to existing SaaS customers. Simply continue using your SaaS deployment for the ingestion and analysis of the environment, while allow the intelligence of Cisco Cloud Observability to analyze logs. From within AppDynamics SaaS, you will find launching the logging analysis tool to be straightforward and provide you with a seamless, contextural based approach to analyzing logs. The view will be pre-filtered, representing the context for which you are analyzing, without the need to adjust the entities, time, date, etc. See Unified Observability Experience and Unified Observability Experience Administration.

Label: Unified Observability Experience: SaaS View Related Logs

Label: Unified Observability Experience: Viewing APM logs in Cisco Cloud Observabilty
Cisco product and portfolio naming changes
- Cisco Full-Stack Observability Platform is now the Cisco Observability Platform
- Cloud Native Application Observability is now Cisco Cloud Observability
Smart Agent with centralized agent management
Cisco AppDynamics has greatly improved agent lifecycle management for cSaaS and On-Premises with the advent of the Smart Agent, a single agent install per machine, which helps orchestrate application and machine agent tasks initiated by an enhanced user interface and/or CLI.
This new enhancement focus on three areas:
- Accelerates Time-to-Value with faster deployments and easier upgrades, reducing time and effort.
- Simplifies software compliance with agent version auditing, bulk upgrades, and rollback capabilities.
- Increases agility to employ the latest functionality and addres changes without a reduction of time or effort.
Quickly uncover which agents are healthy, which have pending updates available, such as enhancements or bug fixes, those that are out of date or unknown to help ensure compliance and security. You can perform bulk agent operations, such as installs, upgrades, or rollback operations of agents along with gaining deep agent inventory knowledge such as mapping agents to applications, tiers, and nodes. Choose a specific agent version to upgrade to and review logs should upgrades not go smoothly. Export an inventory grid, which can be used to generate a report for agent compliance and filter in on what matters to you via. the application or agent type.
Centralized agent management happens within the existing and enhanced user interface, but there has also been an advanced CLI provided – supporting those who need container deployments, integrate auto-attach parameters, and more! The CLI offers customers who have existing tooling pipelines to quickly take full advantage of the Smart Agent capabilities for agent lifecycle management.


Google Core Web Vitals Support in cSaaS
Core Web Vitals provide a holistic overview of user experience while browsing a website, giving insight into load time (LCP), interactivity (FID), and visual stability (CLS). In addition, Google is incorporating these metrics as a signal in search rankings. This change has made it crucial for our customers to track and improve page experience and avoid negative consequences on search rankings. This initial release focuses on the JavaScript Agent framework.

Revenue loss metric for Cisco Cloud Observability (formerly Cloud Native Application Observability)
You can now configure and visualize the Revenue Loss metric to correlate performance issues to business impacts and perform segment analysis for business transactions. This helps to easily monitor and understand how application performance impacts business performance. In total, there is a single point of reference to get the average cart value, total carts sold, and the total cart value in addition to revenue loss.

Log Processing Rules Cisco Cloud Observability (formerly Cloud Native Application Observability)
A new interface has been added which allows a user to specify server-side log parsing rules to extract fields from incoming log messages at the time of ingestion, which has many benefits:
- Quickly filter log messages based on extracted fields and focus on the relevant log messages.
- Leverage pre-defined extracted fields for searching, alerting, and creating dashboards.
- Standardize field names, simplify searches, improve search performance, and apply the same rules to new log sources and hosts.

Spectro Cloud® Palette support for Cisco Cloud Observability (formerly Cloud Native Application Observability)
Cisco Cloud Observability, formerly known as Cisco Cloud Observability, now integrates with Palette out-of-the-box, seamlessly correlating cloud-native infrastructure and application performance across any location and with a few clicks, for peace of mind. Get instant visibility through your entire stack, wherever it resides.
Monitor modern applications and their dependencies and power Kubernetes anywhere!
Quickly identify the fault domain of customer-impacting issues by correlating performance and user experience across hosted and cloud-dependent services for the application, infrastructure, Kubernetes, end-user client, and internet.
The partnership between Cisco and Spectro Cloud delivers operational simplicity to organizations looking to provide governance to Kubernetes deployments and to solve the challenge of consistent observability across the full stack.
- Out-of-the-box integration with Spectro Cloud® Palette for end-to-end Kubernetes observability across any environment.
- Correlate Kubernetes infrastructure and APM services.
- Unified management across the full Kubernetes stack.
- Visualize large-scale Kubernetes clusters (1000s of pods and containers).
- Gain proactive lifecycle diagnostics and governance.

Cost Insights Teams feature for Cisco Cloud Observability (formerly Cisco Cloud Observability)
The Cost Insights module calculates workload costs and enriches the Cisco Cloud Observability user interface with cost metrics for APM services, host cost, and Kubernetes entities such as per cluster, namespace, and pods. It empowers businesses and engineers to understand resource utilization and the costs associated with those resources, helping provide more insights and control over cloud budgets vs. cloud usage vs. cloud spend.
The new Teams feature provides the option to create cost aggregations based on teams in order to assign Kubernetes entities, APM services and host cost types of resources to teams of users. You can now assign a budget to infrastructure costs owned by a team, which, once created, infrastructure costs are monitored to get insights on the daily consumption in reference to the projected monthly costs. Based on the current costs associated with a team, you could then project approximately which day of the month the budget limit will be reached or make necessary adjustments to stay within the budget constraints; calculated budgets, or those that are based on the previous month usage vs. fixed budgets, those that are set by the user.
You can also set health rules to be alerted when costs exceed the budget.


Cisco Secure Application for Cisco Cloud Observability (formerly Cloud Native Application Observability) – Business Risk Observability
Proactively prevent exploits, data leaks and legal actions! With the release of the Business Risk Observability with Cisco Secure Application for Cisco Cloud Observability module, we ensure you can secure deployments with container-based security level scans accounting for threats and vulnerabilities. This will allow you to reduce the risk of personally identifiable information, or PII, data leakage with runtime data security detection. You will easily identify the biggest risks by leveraging scoring algorithms for container and data security with business impact and runtime behavior in focus.


Business Metrics for Business Transaction for Cisco Cloud Observability
Business transactions are at the core of what we know about how the business operates at a technological level, and measuring their performance gives us a direct understanding of IT investments. But not just measuring business transaction performance, we need to go deeper in evaluating metrics the business can relate to, such things to an eCommerce shop as the total number of carts being sold and their respective values. Knowing these kinds of values gives us several advantages. One, we have a clear indication of how imperative some business transactions are over others, so by knowing which ones are directly influencing revenue, we can prioritize issues, and two, we can baseline processes so can make strategic investment decisions in IT or application development that will improve areas, such as customer experience. By enriching investigations with aggregated business metrics, one correlates performance issues with business impacts to perform segment analysis.
Read more about this in the Cisco Newsroom!

OpenAI API Monitoring
Reduce costs and optimize the performance of APIs by analyzing OpenAI APIs. The AppDynamics Java Agent will assist companies looking to stay in compliance by analyzing metrics such as calls per minute, the costs involved, errors per minute, and Chat GPT tokens. These metrics are viewable in an easy-to-read dashboard.

Cisco Secure Application for cloud-native applications
Infra Security
Infrastructure-based security insights help to reduce and remediate risk. Enable security visibility of deployed K8s and container security configurations, assess crucial entities that have vulnerabilities to address business risks for specific applications, and gain deep insights into vulnerabilities to score and remediate based on recommendations.

Data security – logs
Data protection health rules can protect logs from sensitive data. Be able to identify log entries that have sensitive data and label them to quickly list, view, and classify them. Uncover the details by enabling the ability to drill down into those flagged as having sensitive data and being able to redact or delete that data. Define data security log protection policies in order to have total control, including enabling and disabling them

Business Transaction favorites and user-defined Business Transactions for Cisco Cloud Observability
Those business transactions that are most important can now be favorited, along with those business transactions that had not automatically been introduced, which can be manually created giving you a more personalized view of what matters to the business. Having greater control of business transactions means a shorter time to identify and resolve issues that affect the most important business operations.
Marking a Business Transaction as a favorite is easy!


Adding a new Business Transaction is easy!

MELT Exploration for Cisco Cloud Observability: Query builder & Schema browser
Get to know your product deeper by understanding the connections, and trust the UI. Now have the capability to fetch any MELT data to be able to answer the questions needed for deep analytical troubleshooting and build proof for the hypothesis keeping the context wherever you go, sharing that knowledge as you see it! Understand and address zero entity metadata by taking ownership of the creative aspects of the schema.

FSO Platform Exchange
Cisco Cloud Observability Cost Insights, Workload Profiler & Application Resource Optimizer
The Cisco Observability Platform Exchange supports those end-users who want to extend Cisco full-stack Observability. This extensibility is supported through the subscription of modules that are developed by Cisco and/or outside developers – fully supporting community led development and support. These modules are accessed from within the latest release of Cisco Cloud Observability by clicking Cisco Observability Platform Exchange. Initially, as of the time of this notice, administrators may request, or subscribe, to the following modules, but more are being developed:
- Kubernetes Cost and Workload Profiler - analyzes workloads running on a Kubernetes cluster to identify performance and reliability risks and inefficient configurations.
- Cost Insights - leverages the existing customer metrics of the FSO platform, analyzes the workloads running in cloud and cloud-native infrastructures, and generates detailed cost data for all infrastructure workloads and services.
- Application Resource Optimizer (ARO) - automates workload optimization and enhances resource allocation efficiency.


Application Resource Optimizer module for Cisco Cloud Observability
Optimize K8s workloads to derive cost and performance benefits, provide deeper insights into a K8s workloads and visibility into the workload’s resource utilization, analyze and optimize application workloads to maximize resource usage to reduce excessive cloud spend, and get realistic recommendations that the user can go and update in their cloud environment to reduce their costs and improve performance.

Google Cloud Platform (GCP) support for Cisco Cloud Observability
Google Cloud Platform launch – this is a highly awaited capability launched in June as a result of lot of acceleration efforts to make this happen . This is critical to support the needs for customers like Sabre and many others opening up a new segment for the Cisco Cloud Observability product . First service to be launched is Compute with a fast follow of PubSub, Disk, Functions, App Engine, & Load Balancer planned in upcoming releases.
Read more about Google Cloud Platform support.
Sensitive Data Masking for Cisco Cloud Observability
Sensitive Data Masking capability for Logs is now a part of Data Security on Cisco Cloud Observability powered by the Cisco Observability Platform. This solves a critial need to ensure the data in logs, considered private or sensitive, is addressed through a masking feature that occurs in the pipeline rather than after data has been ingested. This means we are providing a super efficient method for data masking/ingestions and ensuring the data is never exposed, reducing potential concerns around data breaches, helping audit teams with their concerns around compromisable data in logs, such as health records, national IDs, etc.

Terraform Provider for Cisco Cloud Observability
Cisco AppDynamics offers the Terraform plugin in order to assist with instrumenting Cisco Cloud Observability as a product by a Terraform Provider. This will help our customers automate and streamline deployments, addressing the typical complexities faced with cloud provisioning in large enterprise environments.
Terraform is widely used by developers as an open source infrastructure-as-a-code tool that helps them define how cloud and local/on-premises resources should be provisioned, such as how physical resources need to be provisioned to run an application. The advantage Terraform provides is the ease of managing simple-to-read files that can be reused and shared, greatly supporting productivity efficiencies.
Customers are able to:
- Create and manage API client applications/OAuth tokens as code
- Create and manage cloud connections
- Query MELT data from Cisco Cloud Observability
Read more about Cisco Cloud Observability Plugins.
Trace-Log Correlation for Cisco Cloud Observability
Tracer-Log correlation supports troubleshooting modern applications being monitored in Cisco Cloud Observability. Performance issues can now be identified with precision by quickly and seamlessly gaining access to all relevant traces of a business transaction and further, offering direct access to the associated logs for rapid root cause analysis. All of this happens within the same tool and with minimal mouse clicks.
Read more about Trace and Log Correlation.


On-Premises Summer updates
There has been a number of feature enhancements, including:
- Dash Studio came in July which is essential in providing dashboarding capabilities and customization options that help customers correlate what they need and where they need it. Be on the lookout for the ThousandEyes widget coming in October!
- The Private Synthetic Agent is not new, however, there has been a valuable enhancement that eliminates the need for an external Postgres database. A reduction in infrastructure is always welcome, reducing costs and complexities for our users!
- Having Server action suppression for servers gives customers the control to put servers in maintenance mode without worrying about false alert storms.
- Infrastructure-based license (IBL) will ensure our customers have the options that save them money and ease their administration.
- There are also a number of enhancements around database visibility and more, so check out the On-Premises Release Notes for more details!
SAP Security (on cSaaS) Summer updates
SAP is a critial, if not the most critical, business solution and Cisco AppDynaics recognizes how important it is to ensure SAP and non-SAP environments are secure and running optimally with no risk to the business. As part of the quarterly update, Cisco AppDynamics brought three very important security monitoring capabilities to the platform, all having their own out-of-the-box dashboard making these features super easy to gain immediate value. They are:
- SAP user login and authorization security monitoring which captures and lists potentially problematic user-based security issues.
Identifying things like users who have not changed their passwords or who have old passwords, the number of locked users due to failed login attempts, SAP and TMSADM security breaches, the number of users with certain sensitive rights such as SAP_ALL, and more!
- SAP system security monitoring which captures KPIs as metrics, such as changed parameters and dangerous commands and listing them in OOTB dashboards to quickly remediate.
Things like the number of changed parameters, custom SXPG commands, dangerous custom commands, the number of transports imported, and the number of imports with security findings.
- SAP connection security monitoring which identifies core connection metric issues within the ERP system and landscape for remediation.
Things such as collecting the number of RFC connections, the number of anomalies, failed RFC calls, and any SSL that is expired.

Integration between Cisco ThousandEyes and AppDynamics
Introducing Correlated Network Insights in AppDynamics
Seamlessly merge expansive network visibility of internet and cloud environments with trusted application-layer insights. This allows you to:
- Reduce MTTR by embedding network visibility of internet and cloud into user experience troubleshooting workflows in AppDynamics.
- Close observability gaps with dependency-generated network test recommendations from AppDynamics.
- Align teams with correlated application and network health dashboards across AppDynamics and ThousandEyes.
With Correlated Network Insights in AppDynamics, users can proactively identify gaps in monitoring and deliver optimal digital experiences to their customers with our real-time networking and cloud infrastructure metrics correlated with application data and visible within AppDynamics (via exported OTEL metrics). With bi-directional information sharing between APM and NPM, this solution eliminates silos and provides end-to-end visibility to every team – all from within AppDynamics.

Simplifying agent management for AppDynamics Agents
Simply a better way to manage the entire agent life cycle
Cisco AppDynamics is addressing the time-consuming and labor-intensive agent management challenges for SaaS and On-Premises customers that often require a high level of application experience to manage. There is a brand-new set of capabilities that simplifies agent lifecycle management – enabling users to spend more time supporting and developing applications and less time maintaining software used to monitor those applications.
We are talking about rapid time-to-value by automating installations across thousands of hosts, existing and new, improving ease-of-use by integrating into existing CI/CD and tooling pipelines, making upgrades resilient by automatically rolling back an upgrade that experiences an issue, offering a secure approach your organization needs by being able to deploy from your repository or ours, and of course, always being able to react to any need to deploy the latest versions available in the most efficient way possible, always ensuring agents have the latest bug fixes and security patches.
Check out Simplifying agent management for AppDynamics SaaS and On-Premises blog for more information!

AppDynamics Alerting Features
There have been a number of enhancements made recently that provide the best-of-class notification of issues experienced in applications being observed by AppDynamics. These innovations have stemmed from customers such as yourselves, asking our product team to deliver the tools they need to improve their business and end-user experience.
Action Suppression for Servers
Servers going into maintenance should probably not be monitored during that window, as it may skew the performance history and anomaly detection engine, and more critical is that no one wants to get a bunch of alerts for a known and controlled situation. AppDynamics now provides the capability to suppress alerts for such situations, by providing a new window found under the Alert & Respond, Actions menu.

Notifications on Alert Failures
We all love relying on alerts when something goes askew...when there is an issue in the environment, however, what happens if the alert system fails? AppDynamics has taken into account potential alert failures perhaps due to improper alerting configurations on AppDynamics, or perhaps there is simply an endpoint managing alerts that times out. This will allow one to leverage a known pipeline to understand when broader alerts are problematic, for example, leveraging a simple email notification to an AIOps team.

Alerting on Visual Complete Time Metrics
Monitoring what end users experience is at the core of what we at AppDynamics want to provide. It allows us to address the most critical business functions affecting the customers using the applications, driving us to achieve the best customer experience possible. One item on everyone’s list is monitoring how long it takes for the first screen of pages to load in browsers. AppDynamics addresses real user monitoring (BRUM) needs by providing the capability to set health rules to support Visually Complete Time percentile metrics available for pages and virtual pages in BRUM. These will provide insights as to how long the content is rendered and be reported on any issue, such as elongated times.

Cisco Cloud Observability Infrastructure Monitoring Enhancements
Troubleshoot more public cloud infrastructure and correlate APM
When it comes to expanding your cloud services coverage for greater depth and breadth, AppDynamics has you covered. Introducing a number of enhancements, such as Azure App Gateway, App Service, and Logic App. The list goes on with support for Kubernetes Windows container workloads as well.

Cisco Cloud Observability Seasonality for Anomaly Detection
Provide more accurate and useful baselines
What do you think about when we say “seasonality?” What comes to mind, should be an understanding that our digital world changes unexpectedly. Since determining what “normal” looks like, depends on historical data, those unexpected “holiday” spikes may just send out a bunch of false alerts. Adjusting for seasonality will ensure the highest accuracy of our anomaly detection engine. So, we can more accurately determine a basis to compare regardless of seasonality spikes; providing a higher recall and precision on actual issues which results in providing the best customer experience possible.

SAP
Collection of quarterly SAP enhancements
AppDynamics releases SAP enhancements quarterly, so in February, we delivered some notable items, worth mentioning here. For starters, SLT (SAP Landscape Transformation Replication Server) is now fully supported, bringing insights into central finance from SAP and non-SAP systems,. SLT support helps those looking to move to HANA, yet need to keep their old ECC landscape until fully adopted. It also helps proactively detect issues in the replication process, issue alerts, etc. All of this with an out-of-the-box dashboard, making this feature, a quick ROI.
Additionally, AppDynamics Performance Monitoring for SAP Solutions now supports copy detection match rules for the ABAP agent, saving a lot of time and effort to those daily tasks, monitoring SAP virtual memory to help alleviate a system hault due to page files filling up the disk, as well as RFC performance monitoring support and yes, AppDynamics has validated SAP S/4HANA 2022; having gone through extensive validation of ABAP and CrystalBridge Monitoring.

Cisco Cloud Observability Grafana® Plugin
View data on Grafana dashboards
Leverage an industry-leading visualization tool, Grafana, to monitor key metrics using predefined sample dashboards or add new widgets to your existing Grafana dashboards. The Grafana plugin fully supports query building with wizard-like interface utilizing AppDynamics Unified Query Language (UQL), allowing you to quickly create custom charts. Additionally, the Grafana integration with Cisco Cloud Observability provides multi-tenant support so multiple data sources can be combined into one dashboard. When an issue is suspected, Grafana provides the ability to drill directly down into Cisco Cloud Observability to commence with root cause analysis.


Read more about the Grafana plugin integration with Cisco Cloud Observability and visit the AppDynamics Downloads and search for Grafana to get started today!
Cisco Secure Application Alerting
Automate the notification of vulnerability detection
You can now leverage the same alerting policy engine as AppDynamics within Cisco Secure Application to configure alerts in order to receive notifications which can include payloads, or details such as the application or library effected, the CVSS score, and more!

Cisco Secure Application Business Risk Scoring
Respond to threats Faster with business context and threat intelligence
Speed and coordination are paramount when dealing with application security risks, and bad actors can take advantage of gaps and delays between siloed security and application teams, resulting in costly and damaging consequences. Traditional vulnerability and threat scanning solutions lack the shared business context needed to rapidly assess risks and align teams based on potential business impact. To triage and align teams as fast as possible, teams need to know where vulnerabilities and threats impact their applications, how likely a risk is to be exploited, and how much business risk each issue presents.
Cisco is enhancing its Full-Stack Observability solution by introducing new security insights and capabilities that provide business context for application security. The Cisco introduces full-stack observability enhancement: Business Risk Observability blog also goes into more details, but essentially, this new Cisco Secure Application features and functionalities include business transaction mapping to understand how and where an attack may occur; threat intelligence feeds from Cisco Talos, Kenna, and Panoptica; and business risk scoring. By integrating features from our market-leading portfolio of security solutions, security, and application teams have expanded threat visibility and intelligent business risk insights to prioritize and respond in real time to revenue-impacting security risks and reduce overall organizational risk profiles.

Cisco Cloud Observability Root Cause Analysis using Anomaly Detection
Automatically detect anomalies in business transactions
Cisco Cloud Observability now automatically detects anomalies in business transactions by using the Anomaly Detection algorithm. For the business transaction entity type, you can also configure Anomaly Detection by applying filters using tags and attributes and selecting the sensitivity level.

Cisco Cloud Observability Database Monitoring
Reduce the MTTR by correlating metrics between APM, infrastructure, and databases
This new database monitoring feature for Cisco Cloud Observability provides remediation insights and correlation for on-premises and cloud-based databases, with cloud APM and infrastructure. A single pane of glass is provided for many important metrics, such as aggregated wait states, which is where a lot of DB admins spend their time troubleshooting, and others such as execution per minute, average response time, elapsed time, CPU time and ratio, various utilizations, and more! This is going to help any database administrator focus in on whatever may be causing performance issues. There is also an area to check out all the SQL queries.


Cloud Cloud Observability Workload Efficiency and Risk Profile View
Identify risks running on Kubernetes®
The Efficiency and Risk Profile View within Cloud Cloud Observability will allow you to identify performance and reliability risks and inefficient configurations within your Kubernetes clusters. This includes metrics such as average replicas, CPU utilization, and memory utilization.

Cisco Cloud Observability Log Pattern Ranking Detection
Leverage log pattern detection to recognize and rank suspicious messages
To reduce the time to resolution of unknown performance issues, Cisco Cloud Observability introduces the ability to group and rank log messages based on similarities focused on recognizing suspicious patterns. Ranking is calculated based on log patterns, severity, changes, and anomalies. Perform key word or sting searches and then receive a highlighted pattern with a ranking.

Cisco Cloud Observability Trace Exploration
Observe detailed trace data in greater detail
Reduce the challenge of pinpointing the cause of performance issues with the Cisco Cloud Observability Trace Exploration feature, elevating the intake of OpenTelemetry™ data. View a list of available traces and view the spans that make up the trace via a spanning graph. You will have the ability to view multiple traces on a single page, filter down to a specific trace based on the service, business transaction, or span status, and view trace details and the related span graphs. This end-to-end visualization of traces, which you can also read more about in the Cisco Cloud Observability introduces contextual troubleshooting and cloud mobility capabilities blog, alleviates the need to hunt for where the issues may be, as everything is interrelated as to how they interact with each other, down to which methods are being called, and their performance.


Cisco Cloud Observability OpenShift Kubernetes® support expansion
Extend your observability to hybrid-cloud applications
Unify observability across clusters both on-premise and in the cloud, such as EKS and AKS. Self-managed, and also known as self-hosted, OpenShift Kubernetes support extends to the most common enterprise container platforms and supports an easy-to-deployment model on large clusters and is also discussed in the Cisco Cloud Observability introduces contextual troubleshooting and cloud mobility capabilities blog. Take advantage of out-of-the-box health rules to diagnose issues before they impact the business.

Cisco Cloud Observability Business Transaction Insights
Combine business transaction monitoring with Cisco Cloud Observability’s continuous-context experience
Observe applications within Cisco Cloud Observability the way end users experience them in order to remediate potential problems efficiently and optimize performance at speed. Business Transaction Insights allows organizations to expand observability over cloud-native applications correlated with business context derived from AIOps and OpenTelemetry™.

SAP: Business Transaction Detection
Gain context by matching rules
Take advantage of what business transaction detection can provide when it comes to observing application performance. Business Transactions not only provide the context as to how users interact with the applications, but they provide guidance as to what matters, or what is most critical for the business, thus helping to prioritize when it comes to fixing performance-related incidents. Match rules encompass Generic HTTP, OData service, and BSP application types.

SAP: Cloud Connector Monitoring
Monitor SAP Cloud Connector instances
The SAP Cloud Connector is instrumental in creating a secure connection to the SAP cloud, therefore, the health and status of such a connection is vital to understand. AppDynamics now provides a connector in order to monitor this critical services.

On-Premises Getting Started Wizard for read-only users
Read-only users can now create mobile applications
There is a new MRUM App Group with permission that allows non-admins the ability to create new mobile applications within AppDynamics On-Premises. Please refer to the Configure Default Application Permissions documentation for more details.
Cisco Launches Cisco Cloud Observability
Enable the delivery of exceptional digital experiences
Cisco Cloud Observability is a cloud-native observability platform built from the ground up to support applications build on increasingly complex and distributed architectures and services. It accelerates detection and resolution of performance issues via continuous data integrations such as OpenTelemetry™ standards as well as through partnerships with cloud solutions and providers.

Cisco Secure Application Monitor Business Transactions
Map security related events to business transactions
From the AppDynamics dashboard Security Health widget, launching into the Cisco Secure Application environment, you now have the ability to expand on security events being mapped to applications, tiers, and nodes, and include now business transactions. This helps identify the risk profile of business-critical information flows with your application so that you can prioritize what matters most for the business, putting everything into context, as to which aspects of the business are more vulnerable.

AppDynamics for OpenTelemetry™
Ingest and visualize OpenTelemetry™ data
With the advent of embracing open standards for data ingestion, AppDynamics has been not only supporting this movement but leading it as well. For the AppDynamics SaaS platform, this debut is the first in a large number of enhancements to support the evolution of how data is ingested into the APM platform.

Read more about AppDynamics for OpenTelemetry and checkout the many blogs that have been written about it.
AppDynamics SaaS Synthetic API Monitoring
Monitor the health of your APIs within the UI
Leverage the many public APIs provided by AppDynamics to test your externally facing services, or leverage private ones as well for internal testing on the AppDynamics SaaS platform. You can now create web monitoring API jobs as well as synthetic API monitoring jobs.

SAP: Expert Settings UI
Customize the ABAP Agent at a much deeper level
You now have access to an Expert Settings UI which can be accessed using t-code /DVD/APPD_PARAM. This UI will allow you to set things like analytics, number of aRFC resources it needs, setting a specific user to schedule background jobs, and more.

SAP Certification
SAP Certification for NetWeaver and S/4HANA
AppDynamics for SAP is again officially certified by SAP, this time for NetWeaver and S/4HANA. This requires having passed a large number of internal security compliance checks. Read more about what this certification means to you, as well as sharing more of the technical details in the AppDynamics: Driving excellence with SAP Certification for NetWeaver and S/4HANA blog.
JavaScript Error Dashboard
Capture detailed information around JavaScript errors in a new dashboard
There is a new dashboard withing AppDynamics specifically addressing JavaScript errors allowing you to view, and drill down into, all your JavaScript errors to understand their impact in your environment. You can gain a better understanding of the error by uploading map files to enhance your troubleshooting experience.
The dashboard provides monitoring of:
- Metrics for all JavaScript errors discovered in a browser application.
- A summary displaying metrics for a JavaScript error.
- An instance table that lists each occurrence of a JavaScript error.
- A location service for troubleshooting errors by uploading a source map and file to location the exact line where the error occurs.


Cisco Secure Application for .NET
Monitor the security of .NET applications with Cisco Secure Application
Leverage your existing AppDynamics Agents in order analyze libraries for vulnerabilities and protect against different kinds of attacks by leveraging external feeds along with internal data. The CVE (Common Vulnerabilities and Exposures) database is referenced to not only detect, but to provide an indication of how to remediate issues that are detected.

Read more about Cisco Secure Application and AppDynamics and also checkout the debut video or the micro demo.
Synthetic API Monitoring
Monitor the availability and performance of public and private APIs
To address the growth with an API-first approach, AppDynamics has released a monitoring feature to address concerns around when APIs are available, if they are functioning properly, ensuring SLAs are met. Included are notifications when there are issues providing the quickest time-to-resolution possible.

Read more about Synthetic API Monitoring and how it differs from synthetic web monitoring in the Synthetic API Monitoring brings proactive monitoring to modern microservices environments blog or on the official AppDynamics documentation. Watch an overview micro demo and Tip of the Month video.
Agent Installer Platform Service API
Use simple APIs to streamline instrumentation of your application
The Agent Installer Platform Service API has been released, greatly simplifying and streamlining the deployment of Java and Machine Agents compatible with Linux. Perform things such as:
- Deploys Java and Machine Agents, and is compatible with Linux
- Automatically instruments applications
- Assigns unique names to detected tiers and nodes
- Upgrades and rollbacks the agents
Read more about Agent Installer Platform Service API.
Security Documents are available for download
Access the security test results for AppDynamics
AppDynamics makes the effort to be as transparent as possible around the effort put forth to discover and remediate vulnerabilities in its software. AppDynamics makes available these test results conducted by independent third-party assessors, such as whom have performed various penetration testing and annual SOC assessments. Access the reports on the AppDynamics downloads site.
AppDynamics Mobile App 2.0
Swifter and more efficient incident resolution on-the-go
Always be informed, 24/7, in real time with insights on-the-go to triage problems quickly in order to reduce MTTR.


Cisco Secure Application for AppDynamics
Maximize speed, minimize risk with runtime application security
Protect your business-critical applications at runtime by using Cisco Secure Application for AppDynamics. Built in collaboration with Cisco Security, Secure Application drastically simplifies vulnerability management and protects against attacks and threats in real-time. Built natively into the AppDynamics full-stack observability platform, Secure Application correlates performance and security data to enable App and Security teams to minimize risk and maintain peak performance.

ThousandEyes integration with AppDynamics in Dash Studio
Correlate application and network performance with a single pane of glass view
This native integration of network and internet performance metrics from ThousandEyes, the industry-leading internet and cloud intelligence platform, into AppDynamics Dash Studio, our next-generation dashboarding experience, enables IT teams to:
- Visualize end user, application, hybrid cloud and internet performance data in one place.
- Cross-launch ThousandEyes seamlessly with a single click and gain deeper insights.
- Promote collaboration between AppOps and NetOps teams to improve efficiency.

AppDynamics AWS Lambda Extension
Instrument serverless APM at runtime
Subscribe your serverless AWS Lambda application to take full advantage of end-to-end AppDynamics APM business transaction correlation to provide visibility into the health and performance of your application even through AWS Lambda functions that invoke other functions.

Synthetic Private Agent for On-Premises Platform
Leverage Kubernetes® based agent for private synthetic testing
The new Private Synthetic Agent (K8s Container-Based Agent) is now available for On-premises. See the Private Synthetic Agent documentation for more details.
End User Monitoring correlation with SAP Business Transactions
Correlate between browser snapshots and business transactions
This enhancement provides correlation on the ABAP side to correctly propagate correlation information between SAP BTs and EUM.

Additional SAP monitoring enhancements
- SAP Heap Memory Monitoring
- SAP ICM Monitoring
- SAP Web Dispatcher Monitoring
Cloud Native Visualization
Monitor the metrics of AWS instances
With Cloud Native Visualization, you can monitor the health and performance of AWS instances with both basic (five minute increments) and detailed (one minute granularity) frequencies. Take advantage of automated anomaly detection to remediate issues quickly while breaking down silos, supporting a single source of truth for monitoring your application environment.

AWS Lambda Serverless APM
Automatic setup of instrumentation for your Lambda functions
As an early adopter of AWS Lambda Runtime Extensions API preview, we are proud to announce that our new runtime extensions negates the need for an AppD Tracer SDK and only requires a simple environment variable configuration. Zero code changes not only simplifies deployment but also removed delays coordination with AppDev in the rollout of new features. For more information, see AWS Lambda Serverless APM.
Kubernetes Log Snippets Capture
Capture log snippets and associate with events and containers.
You can manage the pod logs for both SaaS and on-premises environments. You can also view logs for restarted or failed pods, along with logs for the CrashLoopBackoff events. For information, see Manage Logs For Pods.
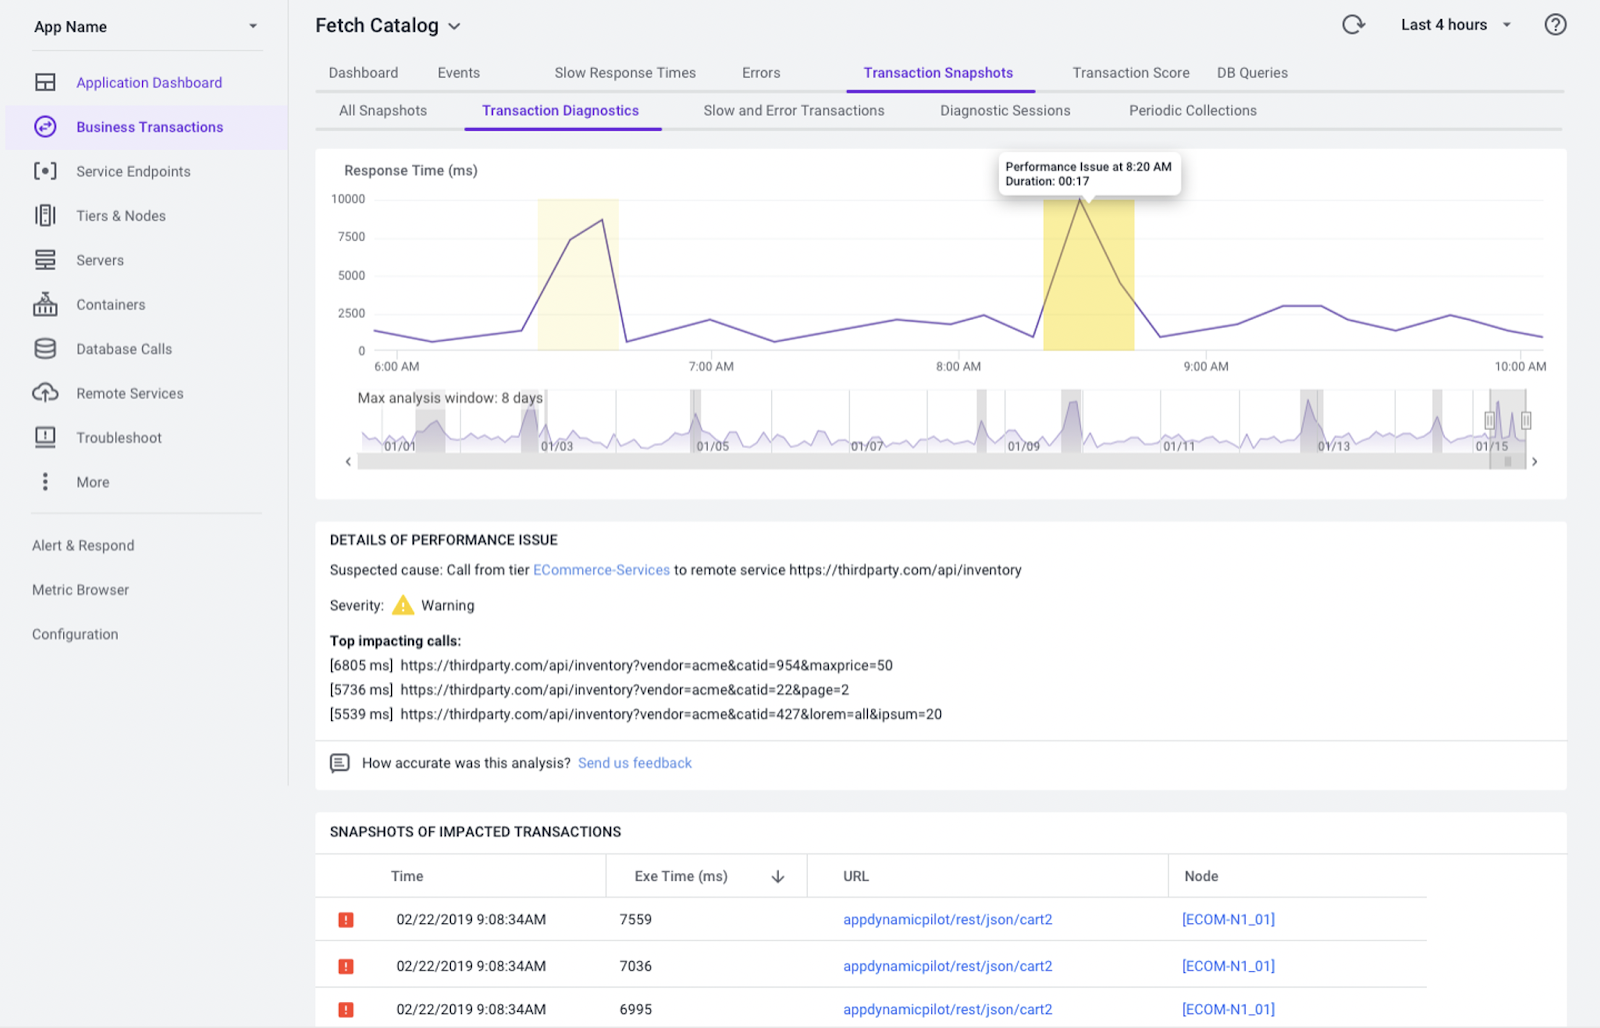
Automated Transaction Diagnostics
Automatically analyze snapshots, using ML, to extract likely root cause
Automated Transaction Diagnostics automates the time-consuming task of exploring snapshots and looking for the likeliest root cause within a database, tier, or exit call - saving you time, reducing the number of clicks to RCA, and ultimately democratizing root cause analysis for operators of various skill levels and application expertise. For more information, see Automated Transaction Diagnostics.
Agentless Analytics for .NET
Reduce your analytics collection footprint
With this enhancement, .NET Agent now supports Agentless Analytics on Windows. You’ll be able to capture business transaction analytics without installing a separate Analytics Agent — reducing manual configuration requirements. Learn more in our Agentless Analytics Overview.
Agent Installer - Express Install
Simplify agent installation with Express Install
The latest enhancement for our automated agent installer simplifies the process even further with preset defaults so that you can just click and go for fast and easy installation.
Kubernetes Cluster Agent - APM Auto-Instrumentation
Simplify container instrumentation at runtime with APM auto-instrumentation
The new version of Cluster Agent now supports auto instrumentation of .NET Core and Node.js APM agents on Linux and along with Java applications.
AppDynamics Announces SAP Peak
Delivering full-stack observability across distributed SAP landscapes with real-time business context
SAP Peak bundles Business iQ for SAP and infrastructure monitoring with existing SAP visibility to enable enterprise organizations to correlate business metrics with mission critical SAP business scenarios. SAP Peak builds on AppDynamics existing SAP monitoring solution with:
- Business iQ for Business Scenario Transaction Analytics
- ABAP Code-Level Visibility
- Deep SAP Performance Insighs
- Server and Network Visibility
For more information, see AppDynamics Announces SAP Peak and AppDynamics Releases Next Generation SAP Performance Management Solution.
June 2020
Experience Journey Map
Visualize performance impact on customer experience with composite user journeys
An industry-first, innovative new way to unlock insights into end-users' most traveled journeys across business applications. Experience Journey Map is rethinking the visualization of end-user experiences and its correlation with performance, featuring auto-discovery of the most transited journeys and changing user patterns within the application.
Experience Journey Map allows you to spot performance problems in the context of your most important user journeys and understand how to prioritize response and triage the problems that have the biggest impact on your business.
Experience Journey Map eliminates the need for “static” custom dashboards and manually setting up health rules for each step of the journey that can take days to complete. Instead, the Experience Journey Map auto-populates in minutes and dynamically adapts to changing user paths.
*BRUM Peak licenses are required to collect and correlate Experience Journey Maps.

Learn more about our new Experience Journey Map feature, here.
Recommended Data Collectors for Business IQ
Self-service data collection for business transaction analysis
New Recommended Data Collectors allows analysts to set up data collectors by themselves, without the need of developer knowledge, providing faster time to value by eliminating developer involvement.
Recommended Data Collectors automatically extract the class and method parameters for each transaction you want to monitor so that you can simply select what you want to collect from an expanded list. The auto-population of fields make it quick and easy to start collecting data to answer your most pressing questions.

Learn more about configuring Recommended Data Collectors.
Automated Agent Installer
Enhanced agent installer instruments environments in minutes, not days
With the help of a set of new components, including the one named “Zero Agent”, our Automated Agent Installer automatically introspects processes running on your hosts and then downloads, installs, configures, and names instrumented nodes and tiers. There is no longer a need to edit agent files or startup scripts. Just run two simple auto-generated commands, restart your application and you’re ready to go.
*Initial release supports Java and Machine Agents with more agents to follow

Learn more about configuring Recommended Data Collectors.
FedRAMP Certification for SaaS deployments
AppDynammics meets data security standards for US Government agencies
Now US Government agencies can have confidence in our solution authorized by the Federal Risk and Authorization Management Program (FedRAMP). Our FedRAMP certified service uses a special instance of our SaaS solution for US Government agencies while ensuring strict security and data privacy standards.
Read more about our FedRAMP Authorization, here.
May 2020
Alert Sensitivity Tuning
Save time, reduce alerts and lower risk with Alert Sensitivity Tuning
Alert Sensitivity Tuning reduces the need to revisit and adjust health rules because of false-positive alerts or lack of them by providing real-time feedback on how often the thresholds are likely to be breached. It does this by applying newly created health rules to metric behavior over the last 8 days to provide immediate feedback on how noisy the alert will be, allowing you to make better tuning decisions during rule creation.
Alert Sensitivity Tuning saves time tuning (sometimes weeks or months), reduces the number of alerts generated, and results in less risk of missing critical situations. AppDynamics’ ability to apply time-sensitive baselines to every single metric provides alerting capabilities that are second to none.
*Read more information on Alert Sensitivity Tuning.
Apache Cassandra and DataStax Enterprise Support
Improve NoSQL visibility Apache Cassandra and DataStax support
Provides key performance indicators on Cassandra objects in order to fully understand the performance of the platform and therefore the impact on the corresponding application. Monitoring includes both metrics and query-level data.
As with all our DB monitoring solutions, the topology view is auto-created and collects standard data such as total time spent in database, wait states, active connections, and more on the whole cluster or per-node basis. Add the ability to see read/write latency and throughput, view a list of queries and groups and drill into a specific query for resource consumption and wait states, and all other metrics specific to Cassandra for maximum visibility and insight.
*Learn more about Apache Cassandra and DataStax Enterprise support.
SAP Agent for AppDynamics 20.5
Get better filtering and analytics with updated SAP support
The latest version of the SAP Agent for AppDynamics provides better PII/GDPR filtering, support for async transactions, and more analytics aimed at visualizing Business Journeys.
This release is the first release to deliver on a customer feature enhancement request through the new Community Idea Exchange and introduces the ability to name RFC destinations by their Program name instead of host and port. This feature greatly simplifies identifying specific applications in the landscape responsible for anomalies and eliminates the need for Ops teams to run down a BASIS team to determine which programs are at fault.
Learn more about SAP Agent enhancements, here.
April 2020
APIs for Action Suppression and Email Digest
Simplify and automate alerting pauses during application maintenance or upgrades
We have extended our CRUD APIs with Action Suppression and Email Digest. This will help simplify and automate alerting pauses during application maintenance or upgrades.
.NET Core 3.1 Support
Support for .Net Core 3.1, brings all AppDynamics core capabilities to your modern .Net frameworks, including full end-to-end tracing, snapshot and call graphs, all with no code change needed.
Alerting Templates
Managing alerts across multiple applications just got a lot easier
The new alerting templates provide you a central area to define, update, and manage your global alert configurations, then apply them to one or many applications. Additionally, new CRUD APIs allow you to programmatically configure health rules, actions & policies and easily replicate your alerting configurations across the applicable applications.
For more information on these and other updates, check out our Community Product Update, April 2020 (v20.4.0 and 20.4.1)
March 2020
Root Cause Analysis algorithm improvements
Significant enhance accuracy and precision
Part of a continued effort to help customers more quickly pinpoint the issues impacting their applications, a new ML algorithm will be deployed that will more than double the accuracy of our Root Cause analysis capabilities.
Deep Code Insights
Simplify debugging, improve developer productivity and slash MTTR
With Deep Code Insights powered by Rookout, debug application code -- even in production -- to non-intrusively and quickly collect critical debug data and pinpoint the root cause of performance issues without adding overhead or impacting the environment.
Deep Code Insights (DCI) simplifies the software debugging process by offering an unprecedented level of visibility into your running code, without slowing performance or disrupting the application and end-users. Whether you’re dealing with monolithic or highly distributed microservices-based applications, DCI provides the critical, on-the-fly data you need to pinpoint performance issues in production.
Learn more about Deep Code Insights and Start a Free Trial, here.
APIs for Actions
Automate the creation and maintenance of AppDynamics actions
We are continuing our alerting CRUD API investments! Following health rules and policies CRUD APIs, we now release new action CRUD APIs to programmatically configure, modify and delete AppDynamics actions. Learn more about these new Action CRUD APIs here.
Time Zone Controller Setting
Better context and collaboration
Easily adjust your time zone with the time zone controller setting to view data in any desired timezone, better collaborate with other users operating in different geographies, and more efficiently troubleshoot issues without having to translate differing timestamps.
AppDynamics’ change to calendar-based versioning
Simplified versioning that is easier to understand
To help you more easily understand the length of support, compatibility, and stability, we implemented a calendar-based approach to versioning for all downloadable products starting March 2020. The release version format incorporates the date of release like so: YY. M. X (e.g., 20.3.0 for the first release in March 2020). For more information, read the FAQ here.
For more information on these and other updates, check out our Community Product Update, March 2020 (v20.3.0)
January 2020
ServiceNow Integration: Server CI Sync
ServiceNow users can now see which applications and services their infrastructure supports together with the customer experience they deliver, their business impact and technical health. Upon issues, users can seamlessly navigate from ServiceNow views right into AppDynamics, in context, for analysis and resolution.
Health Rule Automation with CRUD APIs
The new Health Rule API lets you programatically create, configure, update, and delete health rules and policies across numerous applications. Health Rule APIs allow you to automate your applications’ alerting at scale and with ease.
Experience Journey Map Beta
The Experience Journey Map beta provides customers with the ability to visualize all their most important journeys throughout the application. Customers will see these journeys in the context of performance to determine where investment can enhance the experience for the most number of users. SaaS customers can enroll in the beta via the registration form.
December 2019
AWS Lambda support for Node.js
AppDynamics Serverless APM, supporting the instrumentation of AWS Lambda applications and microservices, now supports Node.js in addition to Java. Serverless APM is packaged in the form of a tracer library for Java and Node.js serverless functions. Learn more about how to utilize our AppDynamics Node.js Serverless Tracer, which provides functionality for Serverless APM for AWS Lambda here.
Resource Performance View
The Resource Performance dashboard gives you a high-level overview of how your resources are affecting your browser application performance. You can use this dashboard to pinpoint resource-related performance issues affecting the user experience.
November 2019
Agentless Analytics for Java
Agentless Analytics for Java streamlines the implementation of Business iQ by removing the requirement that a separate agent be installed to populate analytics data enabling faster access to business analytics data when you need it most.
Kubernetes Cluster Agent
The new AppDynamics Cluster Agent monitors the cluster-level metadata of your containerized applications. The Cluster Agent can be deployed using the AppDynamics Kubernetes Operator, and providers container-level metrics and metadata for pods deployed to the Kubernetes cluster. You will now be able to gain visibility into key Kubernetes metrics and events to detect uptime and availability issues. Learn more about how to install our Cluster Agent here.
October 2019
Modernize Applications By Leveraging Microsoft Azure Platform and Services
AppDynamics announced support for .NET Core 3.0 for Windows and Linux along with enhanced support for App Service Web Apps, WebJobs, and Azure Functions. With our latest enhancements to the .NET Core 3.0 agent, AppDynamics provides more in-depth code instrumentation of applications running in Azure App Service Web Apps and WebJobs. New Linux OS enhancements allow the .NET agent to capture performance snapshots, automatically collecting a complete call graph with the precise duration of every method, and enabling faster troubleshooting of slow-running application code.
To learn more about the .NET Core 3.0 support along with our support for vital Azure technologies, view our webinar on November 20, and access our documentation.

Design Dashboards in Minutes with Dash Studio
With 4.5.15, SaaS customers have access to the beta version of Dash Studio. Dash Studio is the new dashboarding experience with improvements to visualize critical data from AppD in minutes. With Dash Studio, quickly design new dashboards through the new Dashboard Editor using common data widgets, gain richer insights with enhanced data interactions through the Data Panel, and easily reuse dashboards with copy/paste commands.
Dash Studio (Beta) appears under Dashboards & Reports. Your existing dashboards are not impacted. We’re actively seeking user feedback to inform refinements and future capabilities, so please submit feedback via the Feedback button within Dash Studio.
To learn more about specific features, read the documentation. Note: Dash Studio requires AppDynamics controller release 4.5.15 hotfix 1 (build 4.5.15.1933) or above.


August 2019
OpenTracing Support
New open-source observability standards are gaining steam every day, and we are proud to be one of the first to support the OpenTracing Project. The new OpenTracer uses OpenTracing APIs to capture all the BTs, Snapshots, SEPs, Callgraphs, etc. and corresponding metrics from your self-instrumented applications. As a generic OpenTracing implementation, our Tracer can be used with any framework or user application which has OpenTracing calls, and it will be able to capture the AppD relevant information to the Controller.
For an overview and more information, see Open Tracing Support.
Isolate Problems and Monitor Dependencies with Cross-BT Correlation
Cross-BT Correlation will enable service owners to identify or rule out any external downstream dependencies or callers as a root cause before investigating a problem with your service.
With the Cross-BT hovercard, you’ll see which downstream BT your service is calling and monitor downstream BTs that your service is dependent on by showing its dependencies n levels deep and showing its callers for a given BT. Now you can filter snapshots by the calling BT and see the calling BT details in the snapshots.
For more information, see the APM Platform Notes.
Increased Retention of Granular Metrics
In AppDynamics SaaS version 4.5.13, retention of one-minute granularity of metrics data in the Controller has been increased from one day to eight days. This increased retention allows you more time for detailed analysis, reduces the need to export data for external retention and allows AppD to build new features using machine learning to automatically configure new baselines and health rules using this historical data.

Analytics Home Page
Analytics now has a landing page that consolidates key data from the transaction, browser, and mobile events. The new Analytics Home page gives you a holistic view of your Analytics data, consolidating data from the backend to end user sessions in one, out-of-the-box screen. You can now copy text from the results of your ADQL queries for use in other queries.

Reduce Transient Alert Noise with Persistence Thresholds
AppDynamics now allows you to define 'Persistence Thresholds' for health rule conditions. This reduces alert noise and ensures that false alerts are minimised. You can define the 'number of times metric performance data should exceed the defined threshold' to constitute a violation and subsequently trigger an alert. This way, any temporary threshold violation is ignored. For more information, see Persistence Thresholds.

CloudWatch Integration (ELB)
AppDynamics users can now view Amazon-hosted entities and data in several products by connecting their Amazon account to AppDynamics. AppDynamics uses the Amazon CloudWatch API to obtain metrics in near real-time from your Amazon Web Services (AWS) resources and applications. This combination of AppDynamics and AWS cloud-native monitoring helps identify and diagnose a variety of issues within a single Controller. For more information, see Customize Flow Maps.

July 2019
Serverless APM for AWS Lambda is now generally available.
We're delighted to announce that AppDynamics Serverless APM, which supports instrumenting AWS Lambda applications and microservices in Java, is now available to our SaaS customers through the AWS Marketplace.
Serverless APM for AWS Lambda is generally available for SaaS Controllers, version 4.5.11 and later. Serverless APM requires a subscription through AWS Marketplace.
To learn more, read AppDynamics Provides Comprehensive Observability through Serverless APM for AWS Lambda.

Boolean Expression to Evaluate Health Rule Conditions
You can now define a boolean expression using AND and OR operators to evaluate complex health rule conditions for entities in your application. The health rule is considered to violate if the boolean expression evaluates to 'true'.
The advantages of using a boolean expression are:
- reduces the need to create multiple health rules to monitor various performance metrics. It allows you to evaluate complex criteria for multiple conditions in one go
- well-calibrated boolean expression ensures reduced false alerts
- easy to create and maintain health rules with complex evaluation criteria using simple condition names. Conditions are named as A, B, C and so on
- allows the use of AND and OR operators to define a highly complex expression comprising a maximum of 8 conditions
For more information, see Health Rule Conditions and Configure Health Rule Conditions.

June 2019
Monitor Java Applications Running on Windows
You can now set up Network Visibility features to monitor Java applications running on Windows operating systems. You need a Network Visibility license to enable and use Network Visibility features. Refer Windows System Requirements for more information.
For more information, see the Network Agent Release Notes.
4.5.9 - April 2019
Serverless APM for AWS Lambda: Limited Availability
We’re bringing the power of the AppDynamics end-to-end Business Transaction context to microservices deployed in the Amazon serverless environment. We have released a new special purpose “Serverless Compute” APM family, the first iteration of which is delivered in the form of a tracer library, focused on supporting AWS Lambda functions implemented in Java.
Explore Bucket-Level Metrics in Couchbase
Couchbase is a multi-model database, offering document-oriented and distributed key-value features. AppDynamics Database Visibility 4.5.0 focused on support for document-oriented use-cases; this new feature gives full visibility into both models, with deep-dive drill down into bucket level metrics and other KPI’s required to monitor and manage a distributed key-value store. Read documentation for details.

Diagnose Deadlocks with Database Blocking Sessions
AppDynamics Database Visibility has been updated to offer enhanced visibility of locking and blocking in supported relational database environments. Enhancements include the ability to view and analyze more locking events, show increased details of the lock type and locked object, and show the query text of the blocking session (when available). Read documentation for details.
Manage Business Journeys and Experience Levels
Role-based Access Control (RBAC) is now available for Business Journeys and Experience Level Management (XLM). This new capability will allow customers to manage who has access and manage what data they have access to for Business Journeys and XLM. RBAC strengthens data security and safeguards against data leakage. Read documentation for details.
Monitor New Ruby Agent
- The New Ruby Agent supports MRI Ruby 2.3+
- Ruby agent supports any Linux distribution based on glibc 2.5+
- Supports Rail, Sinatra, Grape, and Sidekiq frameworks
- Supports Redis Cache
- NetHTTP, Excon, Faraday, and HTTPClient Exit Points
- Postgres, MySQL, MongoDB, ElasticSearch
4.5.8 - March 2019
Introducing Cognition Engine - AI and ML Powers Automated Anomaly Detection and Root Cause Analysis
Anomaly Detection and Automated Root Cause Analysis are AI-powered features designed to reduce Mean Time To Resolution for application performance problems. Anomaly Detection automatically tells you if every Business Transaction in your application is performing normally. Automated Root Cause Analysis helps you quickly determine the root cause of problems revealed by Anomaly Detection. Learn more about Cognition Engine or read the full documentation for details.

Track Your User’s Interactions Across An Entire Session with New Mobile Sessions API and UI Enhancements
Gain additional insight into your users' actions using the new SessionFrames API, supported in v50.1 of the iOS Agent. This enables you to use business-specific context to break down user workflows. We are working to expand this API to other Mobile Agents soon. The Mobile Sessions UI has also been simplified to make it easier to digest information. Read the documentation for details.

Encrypt Sensitive Text in the Analytics Agent
Organizations with advanced security policies now have the ability to encrypt sensitive text, including credentials, with Analytics Agent v4.5.7. This allows for multi-layered security for passwords stored in the different properties. Read the documentation for details.
Native Support for Multi-Buildpack Solidifies AppD on Pivotal Cloud Foundry
Starting with v4.6.x of AppDynamics Application Performance Monitoring for PCF, the AppDynamics extension buildpack (appbuildpack) offers multi-buildpack support for .NET Core on Linux, .NET Core and .NET Framework on Windows (.NET HWC), Python, and Golang applications. This allows for a single unified workflow for instrumenting your applications regardless of your language or framework and helps you release new AppDynamics features faster. Read the full documentation for details.
Support Modern Java Applications With New Java Framework
Java Agent v4.5.8 adds support for IBM BPM v8.6, enabling you to continue tracking the technical and business performance of your BPM processes as you upgrade to the latest version of IBM BPM. We’ve also added native support for auto-instrumenting applications built using the new WebFlux and WebClient components of version 5 of the Spring Framework, providing end-to-end visibility for the most modern generation of Spring-based web applications. The Java Agent now also provides out-of-the-box support for HTTP Business Transaction flows through Oracle OSB, extending AppDynamics’ end-to-end transaction visibility through this commonly deployed ESB. Read the documentation for details.
Complete Visibility For New PHP Frameworks
PHP Agent v4.5.7 adds out-of-the-box transaction naming support for the Laravel and CakePHP 3.x frameworks. With these additions, owners of applications built with all of the popular PHP frameworks and any current version of the PHP runtime can experience AppDynamics' famous time-to-value and end-to-end Business Transaction monitoring. Read the full documentation for a complete list of PHP supported environments.
Support for Azure SQL Managed Instance
Gain insight into your Azure SQL Managed Instance with AppDynamics Database Visibility. Starting in v4.5.7, you can configure Microsoft SQL Server Collectors to monitor events in Azure SQL. Read the full documentation for details.
4.5.6 - February 2019
Exert More Control Over Your Mobile Sessions
In order to provide you with more control over your mobile sessions, we’re introducing a new API that can be used to define when a session starts and stops. For example, if capturing a mobile session after a period of user inactivity isn’t relevant to your organization but capturing it after a particular network request is, you can customize the session stop definition to suit your needs. Read the full documentation Android, iOS, Xamarin, and Cordova for details.
Monitor .NET Core for Linux With Latest .NET Agent
We are excited to announce support for .NET Core on Linux! After running through a beta program, we are making our first version of .NET Agent v4.5.7 for Linux available to the public. This release includes coverage for multiple distribution versions, including CentOS, Debian, and Alpine. Based on customer feedback, we included a sample Dockerfile to help you integrate the agent into your application deployment faster. Look out for a Pivotal Cloud Foundry buildpack in the future. We are not going to stop here — the plan is to continue adding more features and extend coverage with every monthly agent release! Read the full documentation for details.
4.5.5 - December 2018
Installing Business IQ On Pivotal Cloud Foundry (PCF) Just Got Easier
To separate the task of configuring application performance monitoring and analytics, we've introduced a third tile on the Pivotal Network specifically for application analytics. With this tile, you can deploy an Analytics Agent in the PCF environment to report transactional analytics to your Controller. Additionally, the Extension Buildpack now supports the Java Agent, allowing for advanced configuration and the masking of sensitive information. For details, visit the Application Performance Monitoring, Platform Monitoring, and Application Analytics for PCF Release Notes. You can also check out the latest blog post.
Sync AppDynamics Metrics Into ServiceNow
We’re excited to introduce v3 of the AppDynamics and ServiceNow integration, which offers support for ServiceNow Operational Intelligence. Using the AppDynamics-ServiceNow Data Sync, metrics will flow directly from your AppDynamics Controller to your ServiceNow instances. Take advantage of ServiceNow features like anomaly detection and alerting for automated ITSM and ITOM workflows driven by deeper insights into your infrastructure and applications. For details on the integration, functionality, and metrics, check out our latest blog.
4.5.4 - November 2018
PHP Support for Transaction Analytics
- Service Installer for Database Visibility on Windows
- Additional Metrics for MongoDB
- Synthetic Monitoring for On-Premises Customers
- Plot IoT Data by Geographic Area
Customers with PHP applications can now correlate performance data to business outcomes with AppDynamics Business iQ (previously available to only Java, .NET and Node.js users). With Business iQ, teams have access to a single, flexible platform that ingests, correlates, and visualizes real-time business and application performance data streaming from end-user devices, applications, and infrastructure.
Service Installer for Database Visibility on Windows
To simplify the installation process, you can now run a script to install the Database Agent as a Windows Service instead of having to launch Database Monitoring via the command line. Read the full documentation for details on installing the Database Agent.
To run the database agent as a Windows Service, run the following command as an administrator:

A Windows Services named "AppDynamics Database Agent" will be created. The screenshot below shows the Windows Service Control Manager.

Additional Metrics for MongoDB
We’ve enhanced MongoDB metric collection by introducing four new metrics that will help you dig deeper into Node state changes and Replication performance:
- Replication_MyState
- OplogTimeDiff_in_sec
- Oplog_Size
- Oplog_Max_Size
Read the full documentation for information on all MongoDB Server Metrics.
Synthetic Monitoring for On-Premises Customers
The first offering for Synthetics Monitoring is now available for our on-premises customers. This release of the synthetics server - together with the latest update of the synthetic private agent - enables on-premises customers to monitor the availability of their internal website and applications.
The following diagram shows the connections and data flow between the on-premises Synthetic Server, EUM Server, and Synthetic Agents.

Plot IoT Data by Geographic Area
You can now review geolocation data on your IoT Dashboard to get deeper insights into the performance of your devices by geographic area. Build custom widgets to visualize the data in a representation that works best for your organization. Read our full documentation on monitoring IoT applications.
Health Rules for Network Visibility Metrics
We’ve added a new health rule - Advanced Network - which allows you to easily set health rules for metrics related to network activity, such as PIE (performance impact events), zero window, data retransmission, and errors. This will enhance your ability to see how every application and user is behaving on your network.


ADQL String Manipulation Functions
AppDynamics users who have collected data in the wrong structure, type, serialization, or format have previously needed to adjust their agent settings to specifically focus on potentially interesting insights. Starting in 4.5.2, Business iQ ADQL users have access to string manipulation functions, which empower ad-hoc data transformation for all event data in the analytics event service. With string information functions which return string length() and the indexOf() certain characters in a string, users can easily hone in on a substring(), combine multiple strings with the concat() operator, and trim() out unnecessary repeated characters from the beginning and ends of fields.
EUM Correlation for Vert.x Framework
Our customers can now get the benefit of correlation End User Monitoring visibility and Business Transaction visibility with applications built on the Vert.x framework.
IBM Integration Bus Agent Auto-Discovery and Monitoring of Database Calls
The IBM Integration Bus Agent now automatically detects and monitors database interactions within flows, highlighting the impact of database performance on the performance of Business Transactions flowing through the IIB broker. Read the full documentation for details on the IIB Agent.
Out of the Box Support for Jetty HTTP Client Versions 8 and 9
We now offer out of the box configuration for the Jetty HTTP client which is frequently used within Java applications. Our configuration has been enhanced to provide automatic detection and correlation for versions 8 and 9 of the Jetty Client.
Machine Agent Independent Release
Starting in 4.5.2, you can take advantage of the newest Machine Agent enhancements and bug fixes without waiting for a Controller upgrade. The latest Machine Agents are backwards compatible with any 4.4.0+ Controller, so you can upgrade your agents while upgrading your Controller at a time that works best for you.
.NET Core
With Summer ‘18, we have released full support for .NET Core Agent for Windows so you can easily monitor .NET Core applications running on cloud, hybrid, or on-premise architectures. This lightweight and reliable agent provides full-stack and cross-stack visibility into your application and business performance by collecting infrastructure and end-user metrics. In addition, we are now supporting the Microsoft Orleans framework so customers can more easily track transactions as they move from Orleans Silos to clients. Finally, we have released an SDK for .NET Core for Linux.
Couchbase DB Support
NoSQL databases can be a critical component when developing modern applications that need to deliver simple, high performance data transactions to provide the best possible customer experience. AppDynamics has added support for Couchbase DB in an effort to provide comprehensive monitoring for the entire life of a business transaction including at the database level.

Example of a Couchbase dashboard
Browser Monitoring
We have made several updates to Browser Real User Monitoring to speed up performance analysis. First, we now display a percentile time-series for End User Response Time, so you can quickly see if the majority of your users are experiencing a slowdown, or just a few unlucky ones. Second, we introduced the concept of “Impact Score” for each page, device, browser, and country. If you see that one factor is disproportionately impacted, you can get to the root-cause much faster. Finally, we added resource timing waterfalls for every pageview, so you can always zoom in from a high-level symptom to the root-cause without interruption.
We have added support for single page applications using Javascript frameworks like Angular, React.js and others so that these “virtual” pages are easier to monitor and troubleshoot. This support is optionally available now to anyone who needs to monitor these types of pages.

Viewing various page requests from a single page app built with Angular. Virtual page loads are shown with a “v” in the Type column.
Java Async Applications
We have released improvements to our Java agent that surface asynchronous calls and allow you to drill down into the timing of all the various activities that are happening in your application. This is especially helpful when using our new waterfall view of a particular application snapshot as you can see the overlapping requests that occurred throughout that period of time. Also included in the latest Java agent is support for IBM Business Process Management software so users can analyze the performance and impact of the business processes that are critical to them.
Business Journey Updates
Last November, AppDynamics released a feature called Business Journeys which helps companies track and monitor complex business processes by combining several distinct but related interactions that a end-user has into a single view. We have now improved this capability by adding dashboarding and reporting functionality on top of this view along with custom events to make it easier to visualize exactly how your business processes are performing so you can take action sooner and provide a more consistent experience for the users of your applications.

This Business Journey shows how long it takes to approve a loan.
Mobile Apps
There are more ways than ever to build applications for mobile devices. Sometimes it is more efficient for teams to code their apps in Javascript or other languages and then use tools such as Ionic framework, GoodBarber, and Appy Pie to convert them into apps which run on mobile devices. We now offer better support for non-native/hybrid apps so that app teams can leverage the full performance monitoring capabilities of AppDynamics.

Monitoring a non-native mobile app with AppDynamics.
IoT Devices
We now provide business transaction correlation for IoT devices to provide more context for devices that may have an impact to an application framework or end user experience. We have also released our IoT C/C++ agent under the Apache 2.0 Open Source license. In the fast changing and growing landscape of IoT, this will allow companies to change and improve the code more quickly in order get their particular IoT device data into AppDynamics.

Quickly correlate business transaction issues with IoT devices in flow maps
Network Visibility
We have made troubleshooting network problems easier by adding quick access to network metrics to the snapshot view. Reporting affected network nodes is easier than ever with the new ability to copy IP address information directly from the user interface so you can slack or email that information to a network specialist. You will notice other enhancements to the UI as you use the product as well. In addition, you can now install the network visibility extension for our machine agent.

AppDynamics network visibility dashboard
Pivotal Cloud Foundry
We released our Service Broker Tile and latest buildpacks for Java, Python, Go and .NET. The tile was completely rewritten to support all the latest Pivotal Service Broker APIs, and now adds support for Cloud Foundry's Loggregator System for detailed metrics on the health of the underlying infrastructure.

Kubernetes
We announced the general availability of Kubernetes integration. AppDynamics for Kubernetes gives organizations the deepest visibility into application and business performance. Customers get unparalleled insights into containerized applications, Kubernetes clusters, Docker containers, and underlying infrastructure metrics—all through a single pane of glass.
To gather performance metrics for any resource, AppDynamics leverages labels,the identifying metadata and foundation for grouping, searching, filtering and managing Kubernetes objects. This enables organizations to gather performance insights and set intelligent thresholds and alerts for the performance of Pods, Namespace, ReplicaSets, Services, Deployment and other Kubernetes labels.

Single Page Application (SPA) v2.0
We released SPA v2.0 monitoring capabilities, with improved out of the box support for most modern SPA frameworks and additional benefits including:
- Angular (All versions) and React
- Ability to on board new frameworks without requiring additional changes
- Accurately capture end-user response time across all virtual pages
- Faster implementation and lower TCO

.NET Core for Windows Server
We announced the general availability of the AppDynamics .NET Core agent for Windows addressing three key operational characteristics - performance, flexibility, and functionality. As companies modernize monolithic applications and increasingly shift parts of their IT infrastructure to the cloud, AppDynamics .Net Core for Windows ensure deep visibility into rapidly evolving production, testing, and development environments.

SAP Monitoring
We announced a new product line that enables troubleshooting and business visibility of SAP business applications on our unified monitoring platform. AppDynamics for SAP not only sees the transactions but also drills down to lines of ABAP code to identify specifically where the slowness is occurring, along with surfacing slow database queries. This solution supports unified monitoring of several SAP solutions, including those business applications on traditional databases running under SAP ECC, along with SAP business applications running HANA sidecars and SAP’s premiere offering, S/4HANA.
Business Journeys
With AppDynamics Business Journeys, application teams can link multiple, distributed business events into a single process that reflects the way customers interact with the business. Business events can include transaction, log, mobile, browser, synthetics, or custom events and are long-running, from hours to days.

Experience Level Management (XLM)
With XLM, enterprises can establish custom service-level thresholds by customer segment, location, or device. XLM also provides an immutable audit for service-level agreements with your customers or internal business units. The product images below show the service levels setup for a connected streaming device, giving an instant view on how services are performing against set SLAs.

Network Visibility
We announced the general availability of Network Visibility, enabling enterprises to understand the impact that the network is having on application and business performance. Network performance measurements are automatically correlated with application performance in the context of the Business Transaction.

Docker Visibility
Docker container metadata and metrics are now first class citizens within AppDynamics. Our standalone machine agent collects CPU, Memory, Disk, and Network metrics to help isolate performance problems in production.

Heat Maps
Heat Maps show cross tier correlation which massively simplifies the comparison of load distributions and identifying performance outliers. For example, during a canary release, a new version of your application might have CPU, memory, or disk issues.
Heat Maps dramatically simplify the identification of performance issues in large microservice environments allowing for more effective canary release strategies.

In the bottom chart we can see one node which sticks out from the rest when it comes to the number of pages paged out.
Mobile Screenshots
Our mobile real user monitoring solution allows developers to capture screenshots during key user interactions to understand, at a deeper level, how users behave within your application. These screenshots provide context to the user session and make it easier to debug issues and improve user experience.

While investigating a mobile user session, you can now optionally capture a screenshot directly from the user’s mobile application. A pink dot indicates where users tapped or swiped within the application.
ServiceNow Integration
With our new ServiceNow integration, IT service managers can now view AppDynamics configuration items in ServiceNow. This allows service managers to correlate infrastructure problems to a specific business transaction. This crucial context allows teams to better prioritize events and incidents and focus on problems that impact user experience.

AppDynamics configuration items such as the application Flow Map can now be pushed directly to ServiceNow and synchronized based on a preset schedule.
JIRA Integration
Our two-way integration with JIRA automatically creates and update JIRA tickets when AppDynamics Health Rules are violated. IT teams can view ticket info within AppDynamics war rooms which results in faster developer resolution.

When a Health Rule in AppDynamics is violated, a ticket gets automatically created in JIRA with a link directly back to the affected Business Transaction.
Trademarks
- Amazon Web Services and Amazon Aurora, Amazon EBS, Amazon Elastic Compute Cloud, Amazon RDS, and Amazon Virtual Private Cloud are trademarks of Amazon.com, Inc. or its affiliates in the United States and/or other countries.
- Microsoft® and Azure® are trademarks of the Microsoft group of companies.
- OpenTelemetry™ and Kubernetes® are the trademarks of The Linux Foundation®.
- The Grafana Labs Marks are trademarks of Grafana Labs, and are used with Grafana Labs’ permission. We are not affiliated with, endorsed or sponsored by Grafana Labs or its affiliates.